
Summary Report
Click Here to download a copy of my Sociology thesis which provides a more in-depth analysis and literature review. All references used (including those in this report) can be found in this document.
Introduction
In response to the COVID-19 pandemic, states implemented their own lockdown policies in order to avoid the spread of the virus. These actions led directly to employment loss for many American workers. The Bureau of Labor Statistics published a report in 2021 that stated that the unemployment rate jumped to 13% in 2020 while it was only 3.6% the previous year. Though there is an abundance of literature on this subject, most of it does not use recent labor data or attribute their findings to individual states even though the individual states were responsible for creating and enforcing their own lockdown policies. The research represented in this report sought to understand how exactly the lockdown affected the U.S. labor force state by state, over time. Two hypotheses were proposed to address this issue. The first hypothesis was that all occupation groups lost workers in 2020 due to the lockdown and regained workers in 2022, but it was service occupations that suffered the greatest proportional loss of workers. The second hypothesis tested whether states with higher proportions of service workers in 2018 lost more service jobs in 2020, but they also experienced a worker recovery in 2022.
Literature Review
Existing literature on this subject tended to fall into one of three categories of research topics. These were the impact on employment from variables outside of the lockdown, how occupations in different industries reacted to the lockdown, and the effects of occupation instability on employment. All three groups of literature tended to reiterate the statement that in-person work which couldn’t be performed remotely suffered greater employment loss. This affected service work the most along with industries that relied on service work such as tourism and food service. Since African American, female, and Hispanic workers tended to compose the majority of labor for these occupations, they tended to suffer higher unemployment rates (Holder, Jones, and Masterson 2020; Klein and Smith 2021). However, an in-person job could usually be performed even without remote capabilities as long as the work didn’t require close face-to-face contact with workers or customers. Meanwhile workers in white collar occupations tended to be able to perform their work remotely since their work was more likely to be more managerial or software oriented.
Though this literature is insightful, many studies drew from data from early in the lockdown making it unrepresentative of the workforce after the lockdowns were rescinded. Also, researchers tended to not attribute these findings to individual states despite the fact that states were responsible for creating their own lockdowns. One exception was a study performed by The Federal Reserve Bank of St. Louis which categorized states based on their number of in-person occupations (2020). Their work was only able to use pre-pandemic data and could not compare the number of state occupations during and after the lockdowns. This, more recent research, focused on filling that gap by using more up-to-date data from the CPS to labor fluctuations before, during, and after the lockdown. The findings were used to measure labor trends within each state to understand how their unique workforces were affected.
Methods
The independent variable time was measured using monthly survey data from the Basic Monthly CPS published by the Bureau of Labor Statistics and U.S. Census Bureau. Insights were gathered using survey responses from February, March, and April of 2018, 2020, and 2022 totaling in nine months for analysis in order to negate the influence of seasonal variation. The dependent variable was the number of jobs in each occupation group and was measured using the occupation classification in the CPS. Respondents were responsible for providing their own occupation details from the previous week while the CPS administrators recoded their occupation into one of six major categories: Management, Professional, and Related; Service; Sales and Office; Construction and Maintenance; Farming, Fishing, and Forestry; Production, Transportation, and Material Moving; and Armed Forces. Since this research was only concerned with measuring the civilian workforce, the Armed Forces were omitted leaving six major occupation groups to analyze.
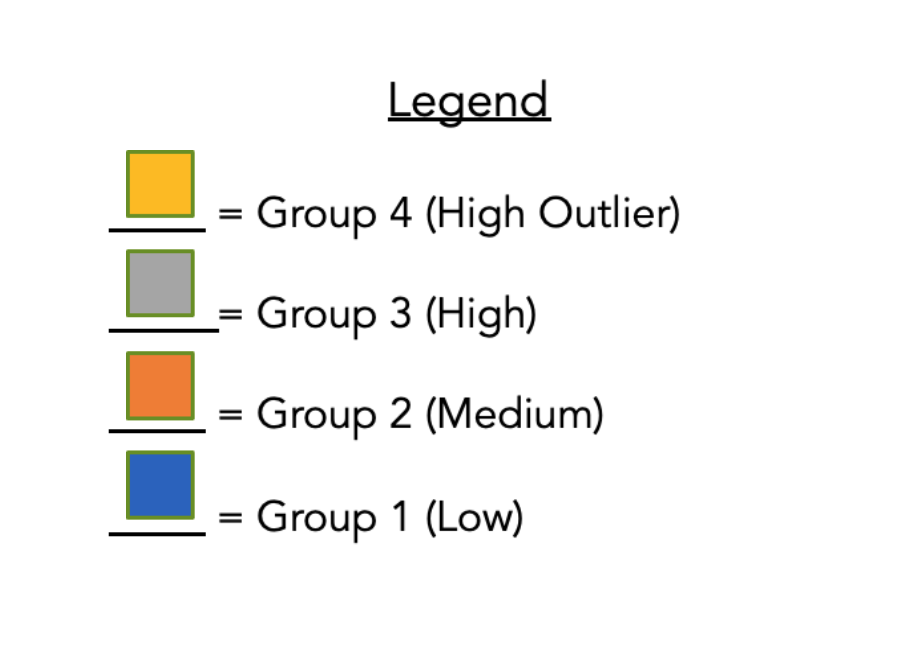
For the second hypothesis, time was measured in the same manner as in the first hypothesis. Along with their occupation details, CPS respondents were responsible for providing their states of residence. Since different states possess different numbers of service workers, this study used the percentage of workers in the Service occupation group and used this metric to compare states. Using natural breaks in the distribution, states were categorized into 4 groups which can be seen in the data visualization located on the “Map” page. States in Group 1 possessed the lowest percentage of service workers between 11.6% and 15.3%. Group 2 states were in the middle range between 15.4% and 19.0% service workers. Group 3 states composed the high range between 19.1% and 22.8%. Group 4 consisted of only Nevada which is a high outlier state with service workers consisting of 26.7% of their workforce.
Tools Used
Microsoft Excel was used to convert and clean the publicly available csv data files located on the Census Bureau website (Link). Linear regression and significance testing for the occupation data was performed with RStudio. SPSS 27 was used to construct paired samples t-test to test the mean difference of state level data over time. Regression analysis and mean testing was not included in this report but can be found in the pdf paper attached to this page (Top of Page).
Findings
Figure 1 Main Highlights
- All occupation groups suffered employment loss in 2020 after the lockdowns were implemented.
- Service occupations started with the third highest value of workers but lost the greatest proportion of their workers suggesting the first hypothesis was accurate.
- Order of Occupation groups based on their percent loss of workers between the starting point and lowest decrease.
- Service: 55.6%
- Sales and Office: 65.6%
- Construction and Maintenance: 70.3%
- Production, Transportation, and Material Moving: 71.5%
- Management, Professional, and Related: 79.7%
- Farming, Fishing, and Forestry: 80.7%
- Construction and Maintenance; Production, Transportation, and Material Moving; and Farming, Fishing, and Forestry were able to retain over half their workers despite relying on in-person labor.
Figure 1: Total Employment Over Time by Occupation Group
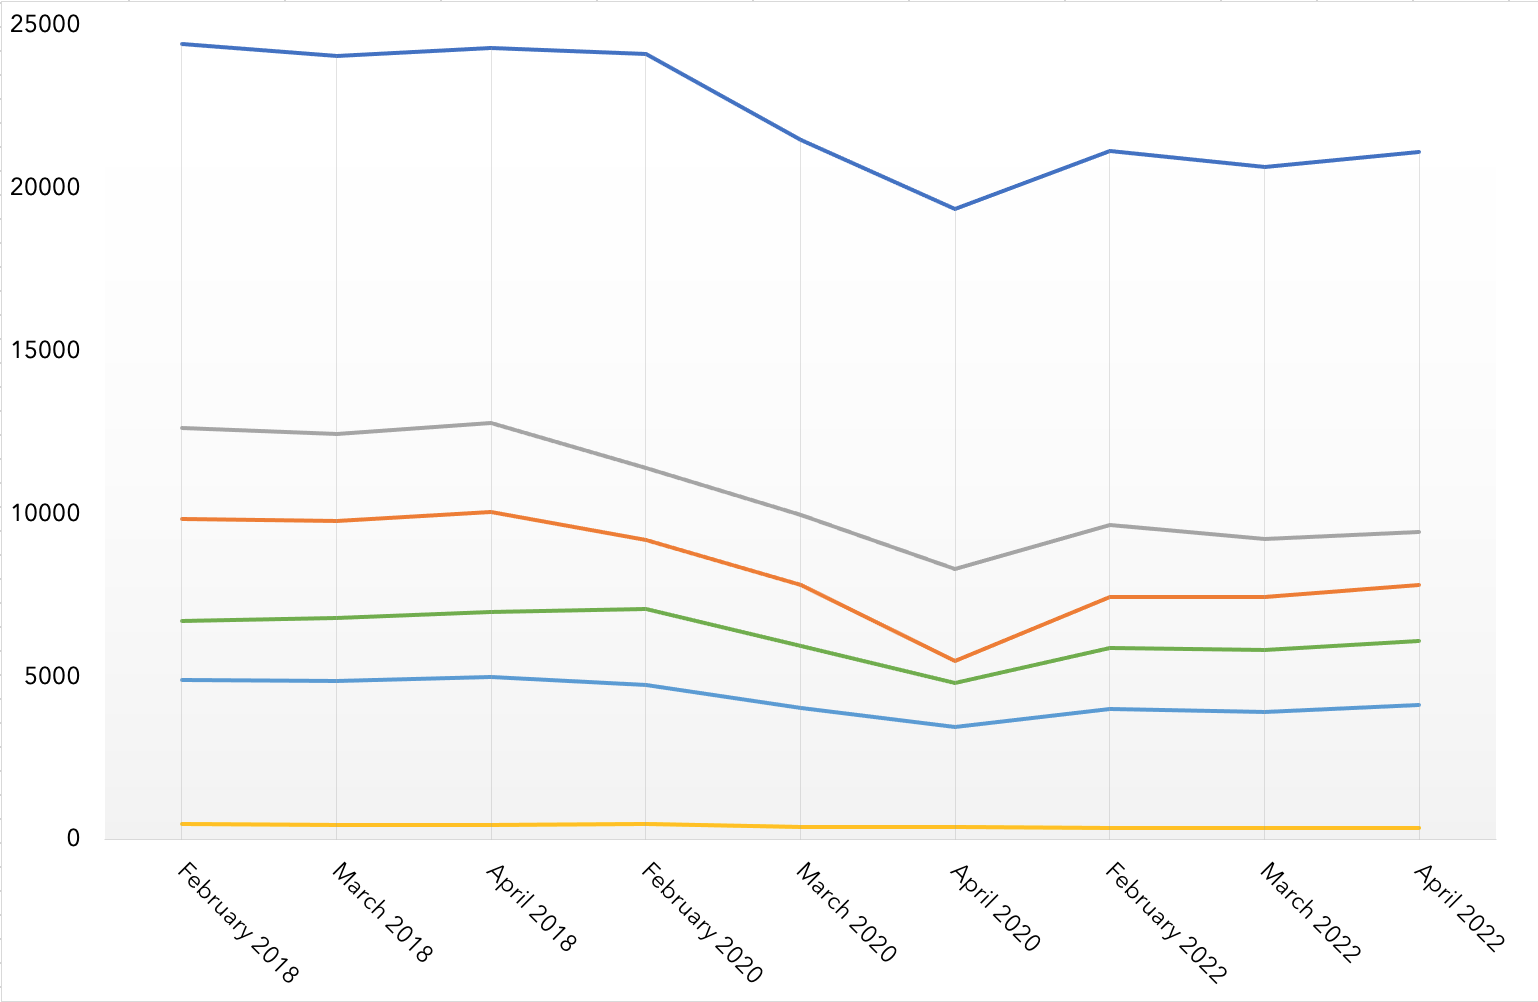
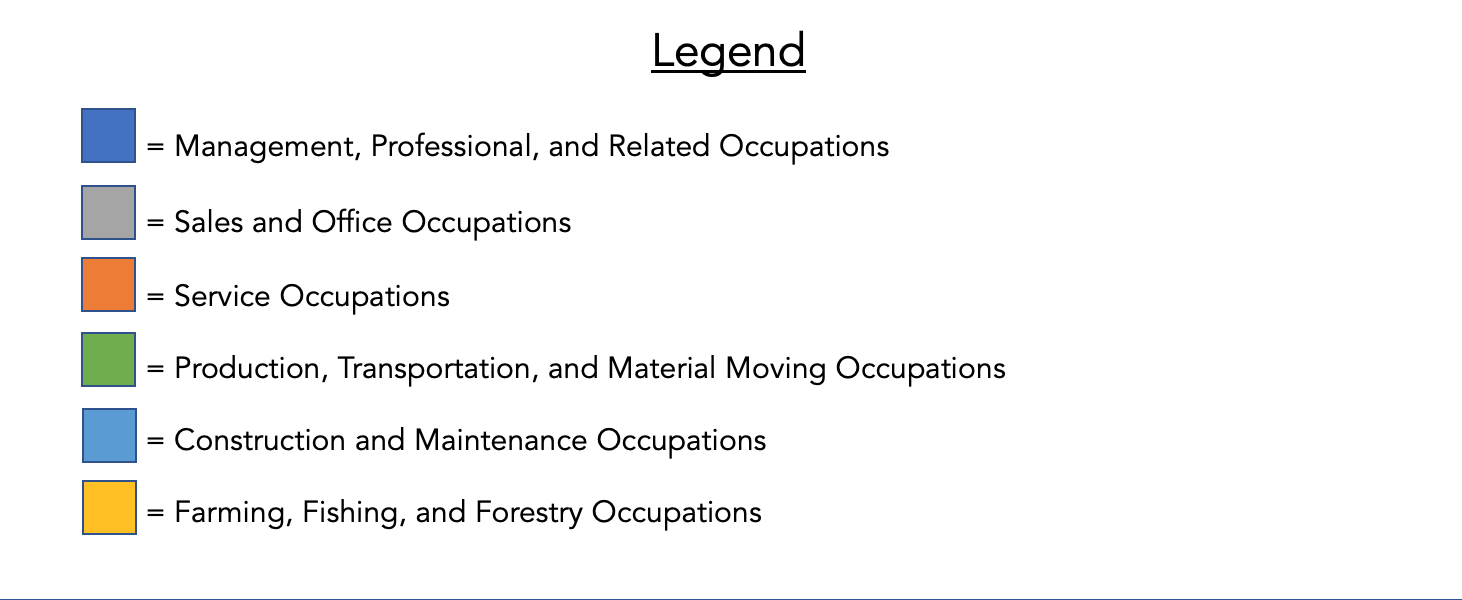
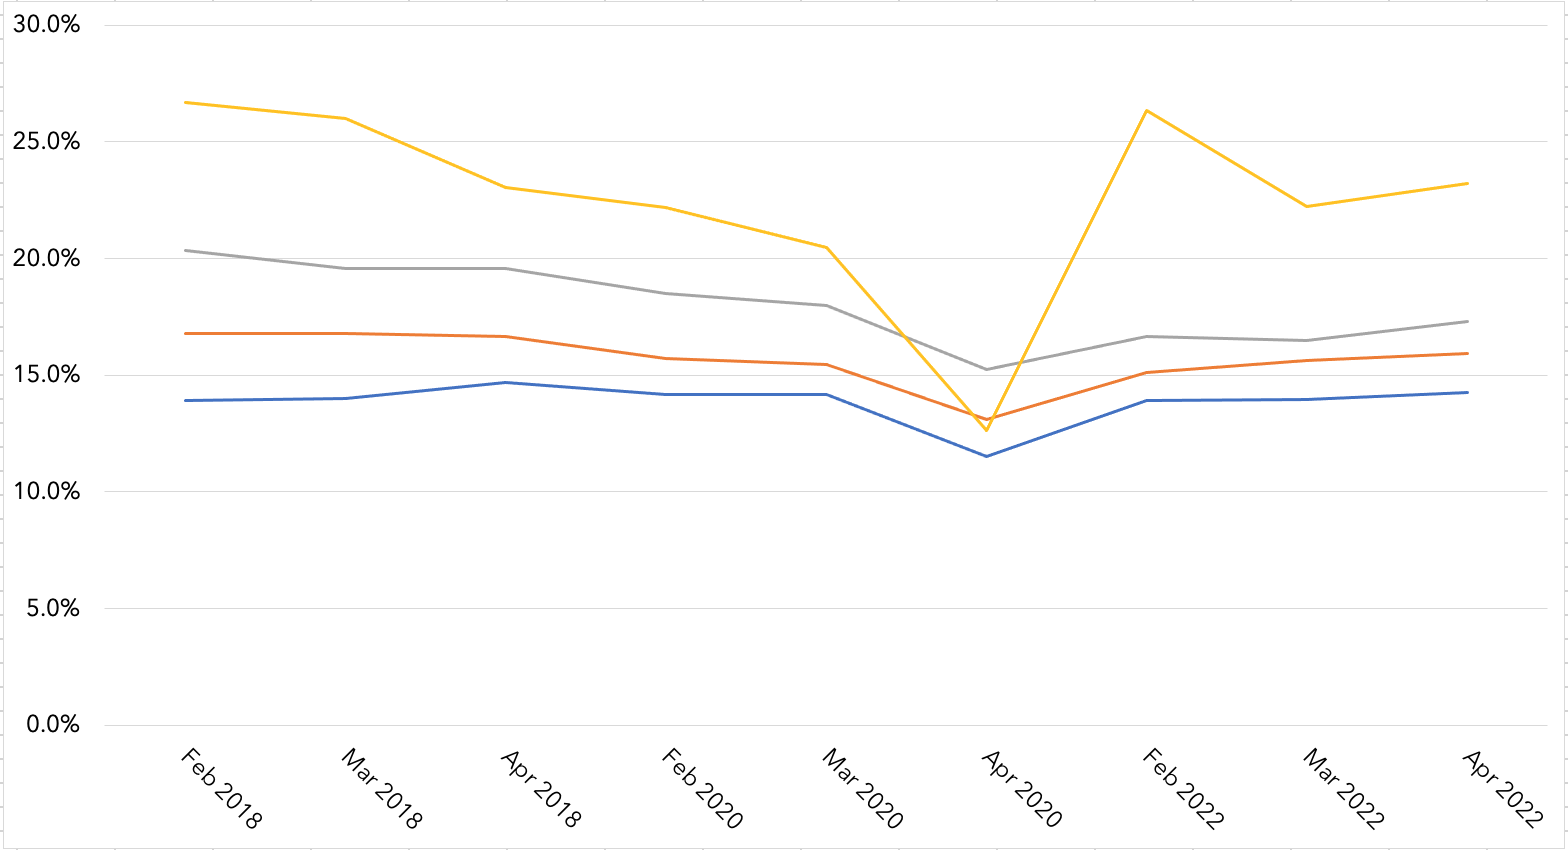
Figure 2 Main Highlights
- All state groups experienced a decrease in percentage of Service workers after the lockdowns were implemented.
- Groups 3 and 4 possessed greater proportions of service workers in 2018 but suffered the greatest percentage loss in 2020 suggesting the second hypothesis was accurate.
- Order of Percentage loss for each group between February 2018 and April 2020.
- Group 4: 14.1%
- Group 3: 5.1%
- Group 2: 3.7%
- Group 1: 2.4%
Figure 2: Average Percentage of Service Workers Over Time by State Group
Discussion
This study sought to understand how the state lockdowns affected the U.S. labor force over time. To answer this question, two hypotheses were tested; first, that all occupation groups lost workers in 2020 due to the lockdown and regained workers in 2022, but service occupations suffered the greatest proportional loss of workers. The Service occupation group lost the greatest proportion of workers in April 2020 since the working conditions tended to directly conflict with lockdown policies. However, despite their face-to-face nature, certain occupations such as Construction, Farming, and Transportation were able to retain more of their workers. The findings of this report reinforced the previous research by demonstrating that these occupations were able to adapt to the lockdown since they did not require close face-to-face contact. For future pandemics, these insights can be used to predict which occupations will still be able to be performed either in-person or remotely and which will need greater protections in terms of health and stability.
The second hypothesis theorized that states with higher proportions of service workers in 2018 lost more service jobs in 2020, but they also experienced a worker recovery in 2022. Only one study generated insights that were relevant to this argument but they were based on pre-lockdown data making them unrepresentative of the workforce during and after the lockdown (Federal Reserve Bank of St. Louis 2020). The findings of this study directly addressed the data gap by using recent labor data to measure the impact on service occupation for each state before, during, and after the lockdowns. Business leaders and workers will be able to use these findings to understand which state workforces were more adaptable to the lockdown and use them as case studies to prepare for future work disruptions. Future research can build on this work by considering certain state workforce variables such as education, ethnicity, and age to understand how these may have affected workforce changes over time.